How to Build a Household Budget Spreadsheet That Works
A spreadsheet remains one of the most powerful budgeting tools — free, flexible, and completely under your control. Learn how to build a household budget spreadsheet with the right structure, formulas, and visual elements.
Why a spreadsheet is still the best budgeting tool
Despite the rise of budgeting apps, a spreadsheet remains one of the most powerful and flexible budgeting tools available. It's free (Google Sheets, Apple Numbers, LibreOffice Calc), works offline, has no subscription, and gives you complete control over how your budget is structured.
A spreadsheet doesn't tell you how to budget — it lets you build the system that works for you. Whether you want a simple income-and-expenses tracker or a complex multi-sheet workbook with charts and projections, a spreadsheet can do it.
This guide walks through how to build a household budget spreadsheet from scratch, with the key formulas and structure.
Step 1: Choose your tool
Three main options, all free:
- Google Sheets — free, cloud-based, works in any browser, easy to share. The best choice for most people.
- Microsoft Excel — part of Office 365 (paid) or available as a free web version. More powerful than Google Sheets but overkill for most budgets.
- Apple Numbers — free on Mac/iOS, simpler than Excel, good if you're in the Apple ecosystem.
For most people, Google Sheets is the right choice — it's free, accessible anywhere, and has all the features a budget needs.
Step 2: Set up the structure
A good budget spreadsheet has three sheets (tabs at the bottom):
Sheet 1: Summary
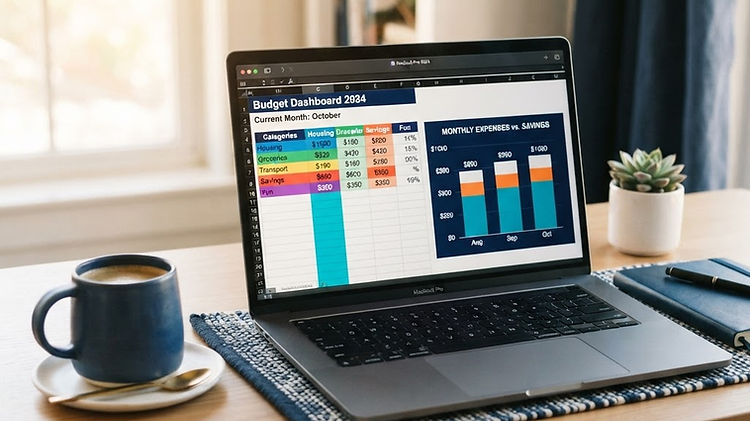
The dashboard. This is where you see the big picture at a glance:
- Income this period
- Total expenses this period
- Remaining money
- Savings rate
- Key categories with planned vs actual
Sheet 2: Transactions
The raw data. Every income and expense is a row, with columns for:
- Date
- Description
- Category (dropdown: Housing, Food, Transport, etc.)
- Amount (positive for income, negative for expenses)
- Account (which account was used)
Sheet 3: Categories
The planning sheet. Lists each category with:
- Budgeted amount (what you plan to spend)
- Actual amount (summed from transactions)
- Difference (budgeted minus actual)
- Notes
Step 3: Create the transactions sheet
Start with the Transactions sheet — it's the foundation. Set up the columns:
| Date | Description | Category | Amount | Account | |---|---|---|---|---| | 2026-10-01 | Pay | Income | 1820 | Everyday | | 2026-10-01 | Rent | Housing | -800 | Bills | | 2026-10-02 | Groceries | Food | -145 | Everyday | | 2026-10-03 | Electric bill | Utilities | -180 | Bills |
Add a category dropdown
Use Data Validation to create a dropdown for the Category column:
- Select the Category column
- Data → Data validation
- Criteria: List of items
- Enter: Income, Housing, Food, Transport, Utilities, Insurance, Entertainment, Savings, Other
This ensures consistent category names, which is essential for the formulas to work.
Step 4: Create the categories sheet
The Categories sheet compares your budget to your actual spending. For each category:
| Category | Budgeted | Actual | Difference | |---|---|---|---| | Income | $1,820 | $1,820 | $0 | | Housing | $800 | $800 | $0 | | Food | $400 | $145 | $255 | | Transport | $150 | $0 | $150 |
The SUMIF formula
The Actual column uses SUMIF to total transactions by category:
=SUMIF(Transactions!C:C, A2, Transactions!D:D)
This says: "Sum all amounts in column D of the Transactions sheet where the category in column C matches the category in A2."
The Difference column is simply:
=B2-C2
Budgeted minus Actual. A positive number means you're under budget; negative means over.
Step 5: Create the summary sheet
The Summary sheet pulls the key numbers from the Categories sheet:
Total income
=SUMIF(Categories!A:A, "Income", Categories!C:C)
Total expenses
=SUM(Categories!C2:C9) - Summary_income_cell
Or more simply, sum all expense categories:
=SUMIF(Transactions!D:D, "<0") * -1
Remaining money
=Total_income - Total_expenses
Savings rate
=Remaining_money / Total_income
Format as a percentage. A savings rate of 15–20% is healthy.
Step 6: Add visual elements
A spreadsheet is more useful when you can see the patterns:
Conditional formatting
Highlight categories where you're over budget:
- Select the Difference column in the Categories sheet
- Format → Conditional formatting
- If cell is less than 0, set background to red
- If cell is greater than 0, set background to green
Now overspent categories jump out in red.
A simple chart
Create a pie chart of expenses by category:
- Select the Category and Actual columns in the Categories sheet
- Insert → Chart
- Choose Pie chart
This gives you a visual breakdown of where your money goes — often surprising the first time you see it.
A progress bar for savings
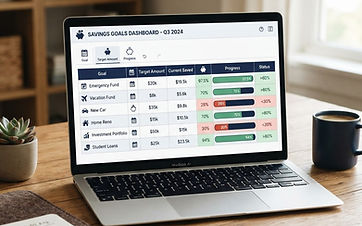
If you have a savings goal, add a progress bar:
- Enter your current savings and target in two cells
- Calculate the percentage:
=Current/Target - Use conditional formatting (data bars) to show a visual progress bar
Step 7: Make it a habit
A spreadsheet only works if you keep it updated. Two approaches:
The daily approach
Enter transactions as they happen — takes 30 seconds per transaction. This keeps the spreadsheet always current but requires daily discipline.
The weekly approach
Set aside 15 minutes once a week (e.g., Sunday evening) to enter the week's transactions. Less frequent but more manageable for most people.
Automate where possible
- Download bank transactions as CSV and paste them into the Transactions sheet. Most banks allow this.
- Use a template so you don't have to rebuild the structure each month — duplicate the sheet for a new month.
Common spreadsheet budgeting mistakes
- Too many categories. 8–10 categories is plenty. 30 categories makes data entry tedious and analysis harder.
- Inconsistent category names. "Food", "Groceries", and "Supermarket" should all be the same category. Use a dropdown to enforce consistency.
- Not separating income and expenses. Use positive for income and negative for expenses, or separate columns. Mixing them in one column without a sign convention makes formulas harder.
- No summary or chart. A spreadsheet full of transactions but no summary is just a list. The summary is where the insight is.
- Overcomplicating. If your spreadsheet has 15 sheets and 200 formulas, you won't maintain it. Keep it simple.
When to move beyond a spreadsheet
A spreadsheet is powerful, but it has limitations:
- No automatic projections. You can build a projection, but it's manual. A tool like Payday Compass projects your balance forward based on income, bills, and spending — automatically.
- No runway calculation. Seeing when your balance will hit zero requires a specific formula setup. The free payday calculator does this instantly.
- No multi-currency. If you're planning travel money, a spreadsheet can handle it but it's fiddly.
- No alerts. A spreadsheet won't tell you when a bill is about to breach your buffer.
For simple budgeting, a spreadsheet is excellent. For projection, runway, and multi-currency, a dedicated tool is better. Many people use both — a spreadsheet for the detail and a tool like Payday Compass for the big picture.
Summary
A household budget spreadsheet has three sheets: Transactions (the raw data), Categories (planned vs actual), and Summary (the dashboard). Use SUMIF to total by category, conditional formatting to highlight overspending, and a pie chart to visualise where your money goes. Keep categories to 8–10, use a dropdown for consistency, and update weekly. A spreadsheet gives you complete control and flexibility — and it's free.
For a tool that handles projection, runway, and alerts alongside your spreadsheet, try the Payday Compass Money Runway.
Put it into practice
The Payday Compass workbook brings these ideas together in one organised spreadsheet.
Explore the Budget Planner