How to Build a Savings Tracker Spreadsheet
A savings tracker spreadsheet is one of the most motivating financial tools you can build. Learn how to set up the structure, add formulas for progress and timeline, create a visual progress bar, and track multiple goals.

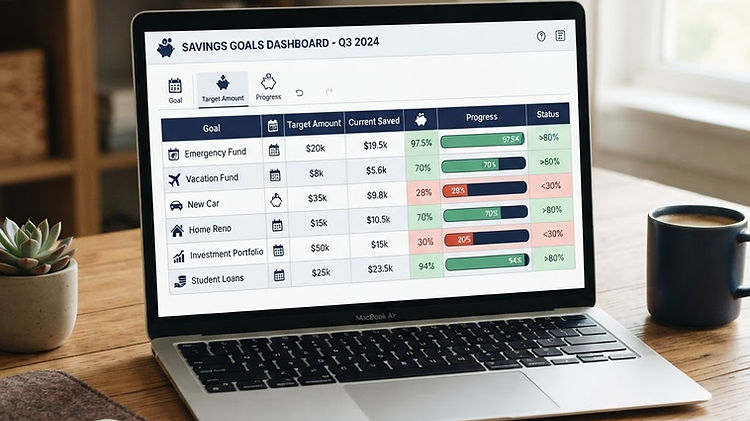
Why track savings in a spreadsheet
A savings tracker is one of the most motivating financial tools you can build. Watching a number grow — seeing your savings goal get closer each month — turns saving from a chore into a satisfying habit.
While apps can track savings, a spreadsheet gives you complete control over the layout, the visualisation, and the calculations. You can build exactly the tracker you want, with the metrics that matter to you.
This guide walks through building a savings tracker spreadsheet, step by step.
Step 1: Decide what to track
Before building, decide what your tracker needs to show. Common elements:
- Current balance — how much you've saved so far
- Target amount — what you're aiming for
- Progress percentage — how far you've come
- Per-pay contribution — how much you need to save each pay
- Timeline — when you'll reach the target
- Contribution log — a record of each deposit
- Visual progress bar — a visual representation of progress
You might track one goal or several. Start with one — you can always add more.
Step 2: Set up the structure
Create a new Google Sheet with two sections:
Section 1: Goal summary (top)
| Field | Value | |---|---| | Goal name | Japan Trip | | Target amount | $3,500 | | Current balance | $1,200 | | Per-pay contribution | $135 | | Pay frequency | Fortnightly | | Target date | 2027-10-01 | | Progress | 34% | | Pays remaining | 17 |
Section 2: Contribution log (below)
| Date | Amount | Running balance | Notes | |---|---|---|---| | 2026-06-14 | $135 | $135 | First contribution | | 2026-06-28 | $135 | $270 | | | 2026-07-12 | $135 | $405 | | | ... | ... | ... | | | 2026-10-12 | $135 | $1,200 | |
Step 3: Add the formulas
Current balance
The current balance is the sum of all contributions:
=SUM(B2:B100)
Where column B contains the contribution amounts. Put this in the "Current balance" cell in the summary section.
Progress percentage
=Current_balance / Target_amount
Format as a percentage. In the example: $1,200 / $3,500 = 34%.
Pays remaining
Calculate how many more contributions you need:
=ROUNDUP((Target_amount - Current_balance) / Per_pay_contribution, 0)
This shows how many pays of $135 you need to reach $3,500. In the example: ($3,500 - $1,200) / $135 = 17 pays.
Estimated completion date
If you know your pay frequency, estimate when you'll reach the goal:
=TODAY() + (Pays_remaining * 14)
For fortnightly pays, multiply by 14 days. For weekly, multiply by 7. For monthly, multiply by 30.
Running balance
In the contribution log, the running balance shows the total after each contribution:
=B2  (for the first row)
=B3 + D2  (for the second row, where D2 is the previous running balance)
Or, more simply, use a running SUM:
=SUM($B$2:B2)  (in row 2)
=SUM($B$2:B3)  (in row 3)
The $ signs keep the starting cell fixed while the ending cell grows.
Step 4: Add a visual progress bar
A visual progress bar makes the tracker far more motivating. Two ways to add one:
Method 1: Data bars (conditional formatting)
- Select the Progress percentage cell
- Format → Conditional formatting
- Format rules: Data bars
- Choose a colour (green for progress)
The cell now shows a bar that fills as the percentage increases.
Method 2: REPT formula (text-based bar)
For a simple text-based bar:
=REPT("█", ROUND(Progress * 20, 0)) & REPT("░", 20 - ROUND(Progress * 20, 0))
This creates a 20-character bar that fills as progress increases. At 34%, it shows about 7 filled blocks and 13 empty ones.
Step 5: Track multiple goals
If you have multiple savings goals (a holiday, an emergency fund, a house deposit), extend the tracker:
Option 1: Multiple summary blocks
Create a summary block for each goal, all on one sheet. Each has its own target, balance, and progress.
Option 2: A goals sheet with a contributions sheet
- Goals sheet: One row per goal, with columns for name, target, current balance, and progress
- Contributions sheet: Every contribution, with a column for which goal it's for
The current balance for each goal uses SUMIF:
=SUMIF(Contributions!C:C, A2, Contributions!B:B)
This sums all contributions where the goal name matches the goal in A2.
Step 6: Add milestones
Milestones break a long savings journey into smaller, motivating targets:
| Milestone | Amount | % | |---|---|---| | First $100 | $100 | 3% | | Quarter way | $875 | 25% | | Halfway | $1,750 | 50% | | Three quarters | $2,625 | 75% | | Fully funded | $3,500 | 100% |
Use conditional formatting to highlight milestones you've reached:
- Select the milestone amounts
- Conditional formatting → Custom formula:
=B2 <= Current_balance - Set the format to green
Reached milestones turn green automatically as your balance grows.
Step 7: Handle setbacks
Savings journeys have setbacks — you miss a contribution or need to withdraw. Build the tracker to handle both:
- Missing a contribution: just don't add a row that pay. The running balance and pays remaining recalculate automatically.
- Withdrawing: add a row with a negative amount. The running balance decreases, and the pays remaining increase. Add a note explaining the withdrawal.
- Adjusting the target: change the target amount. The progress percentage and pays remaining recalculate.
Step 8: Make it a habit
A tracker only works if you update it. Two approaches:
- Update on payday. Add a contribution row every time you get paid. This ties the tracker to your pay cycle and ensures you save before spending.
- Set a weekly reminder. If your contributions are irregular, set a weekly reminder to update the tracker.
The key is consistency. A tracker updated every pay is far more motivating than one updated randomly.
Common tracker mistakes
- No visual element. A tracker that's just numbers doesn't motivate. Add a progress bar or chart.
- No contribution log. Without the log, you can't see your saving history. The log is what makes progress visible.
- Too many goals at once. If you're tracking 10 goals, none of them get enough attention. Focus on 1–3 at a time.
- Not handling setbacks. If the tracker can't accommodate a missed contribution or a withdrawal, you'll abandon it when life happens.
- Forgetting to update. A tracker that's a month out of date is demotivating. Update every pay.
When a spreadsheet isn't enough
A savings tracker spreadsheet is excellent for tracking progress, but it doesn't:
- Project your balance forward — to see whether you can afford the per-pay contribution, use the free payday calculator.
- Connect to your runway — to see whether saving affects your day-to-day buffer, a dedicated tool is better.
- Handle multiple currencies — for travel savings, a spreadsheet can work but it's fiddly.
The Payday Compass Goal Navigator tracks savings goals with progress bars, per-pay contributions, and connects them to your money runway — so you can see whether your savings are affecting your everyday buffer.
Summary
A savings tracker spreadsheet has two parts: a goal summary (target, balance, progress, timeline) and a contribution log (date, amount, running balance). Use SUM for the current balance, division for the progress percentage, and ROUNDUP for pays remaining. Add a visual progress bar with data bars or the REPT formula, track multiple goals with SUMIF, and add milestones for motivation. Update every payday, handle setbacks gracefully, and keep it simple. Watching the number grow is the motivation that keeps you saving.
To track savings goals with automatic runway connections, try the Payday Compass Goal Navigator.
Put it into practice
The Payday Compass workbook brings these ideas together in one organised spreadsheet.
Explore the Budget Planner


